

How AI Can Help Us Understand Its Own Output
An experiment inspired by Karpathy, using text, diagrams, interactive HTML, and narrated video to explain one idea, with earlier examples of the Agent skills behind them.

In this post, Karpathy shares an idea: as AI completes more work autonomously, people will spend more time understanding and reviewing its results. AI can help with that work, too.
His suggestions are concrete: ask a model to explain things in clearer language, draw concepts and relationships, generate interactive web pages, or create narrated explainer videos.
I already use Codex to generate illustrations and HTML Diagram to understand complex ideas. I use video less often. After reading his post, I wanted to try explaining the post itself in the four formats he described.
The examples below retain the original experiment's Chinese text and narration. This article translates the explanation around them.
1. What did Karpathy suggest?
Karpathy starts with writing. You can ask a model to follow ASD-STE100, a controlled form of technical English originally developed for aviation maintenance documentation. It limits vocabulary and sentence structure to reduce ambiguity. He finds it easier to read, but the rules can be strict, so he sometimes asks for roughly 80% compliance.
Next come diagrams. Showing concepts and relationships can sometimes explain an idea more clearly than a long passage.
Then there is interactive HTML: ask the model to produce a page that explains a topic through interaction and animation.
The format he is most excited about is a custom explainer video, such as a 3Blue1Brown-style animation with voice narration.
He also suggests that stronger models and easier code generation can make it worthwhile to create a page or video just to understand one problem, then discard it. In the past, the production cost often made that impractical.
2. First format: explain it in words
For this experiment, Codex first used asd-ste100-skill to summarize the original post according to its rules.
The skill mainly works with English. It makes lengthy or ambiguous sentences clearer and can help with tool descriptions, error messages, system prompts, instructions between Agents, README files, and PR descriptions.
It emphasizes short sentences, explicit subjects, and consistent terminology, while preserving conditions and uncertainty. Making a sentence shorter should never turn “may happen” into “has happened.”
The experiment's summary was written in Chinese. It borrowed principles of clear expression; it was not a certified STE document. Here is a translation of the core summary:
Language models will complete more work autonomously. People will spend more time understanding and checking the results.
Karpathy suggests four formats to help:
Text: follow ASD-STE100 to reduce ambiguity. If the rules are too strict, ask for roughly 80% compliance.
Diagrams: draw concepts and relationships. Sometimes they are easier to understand than text.
Web pages: generate HTML that explains the content through interaction and animation.
Video: create a custom animated explanation and add voice narration. This is the format Karpathy is most excited about.
As model capabilities improve, we can create a page or video for a single need to understand something, then discard it.
The summary is easy to copy and quote. It also provides a shared source for the diagrams, web page, and video.
When an English explanation is hard to follow, or a tool description or error message leaves conditions and actions unclear, I would consider a request like this:
Use asd-ste100 to rewrite this English explanation. Make clear who does what. Preserve the original conditions and uncertainty.
The skill clarifies language. It does not verify the underlying facts or directly produce images, HTML pages, or videos. Those need other tools.
3. Second format: turn the idea into a diagram
3.1 Direct image generation: show a module's flow
The most direct approach is to give the content to Codex's built-in imagegen skill and ask for a diagram.
In this experiment, Codex used imagegen to illustrate Karpathy's idea in four sections: text, diagrams, web pages, and video. I found the result fairly ordinary, but it is useful to compare it with the illustrations produced through the skills below.
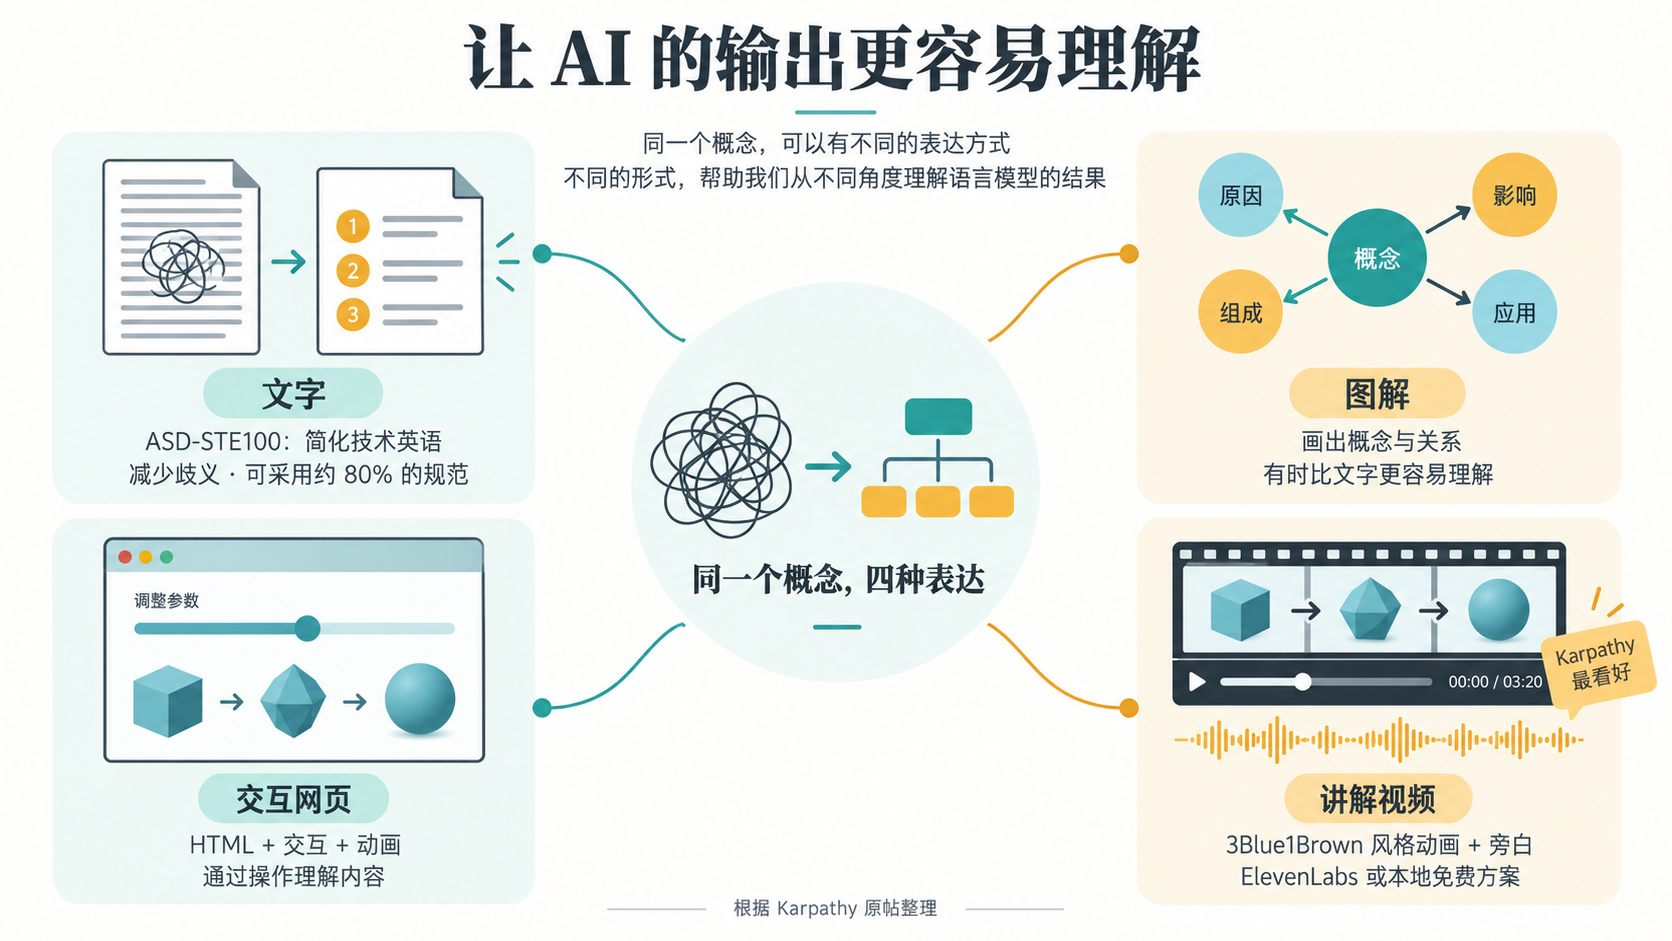
I also use this approach during development. If a module's flow is unclear, or I want to review code written by AI, I ask for a diagram to help me understand it.
In this earlier post about improving email and password login, I used the skill to generate an illustration. Failed email delivery, verification timeouts, retries, and resending introduce branches that can be hard to connect through prose alone. A diagram makes it easier to follow and check the flow.
A practical request might be:
Read this module's code and use imagegen to draw a flowchart. Mark the entry point, key decisions, normal path, and error branches. Highlight the parts AI just changed so I can review them. Base the relationships on the code and label anything uncertain.
A diagram helps with understanding, but it cannot replace code review. Check the branches and arrows against the source.
For a closer match to the content or a consistent illustration style, an illustration skill can analyze the text and plan the layout before directing image generation. Both approaches below use Codex's built-in image generator; they differ in how they organize the material and composition.
3.2 Xiaohei illustrations: explain an idea through a hand-drawn scene
One skill I recommend is ian-xiaohei-illustrations, created by @ianneo_ai. It uses hand-drawn scenes on a white background, a few Chinese annotations, and the Xiaohei character taking part in the main action to illustrate an idea, flow, or relationship.
For this experiment, Codex used a customized version called fox-illustrations. It replaces Xiaohei with a little fox and adjusts the character design and colors. In the illustration, the fox feeds one concept into a hand-cranked machine, which produces text, a diagram, a web page, and a video.
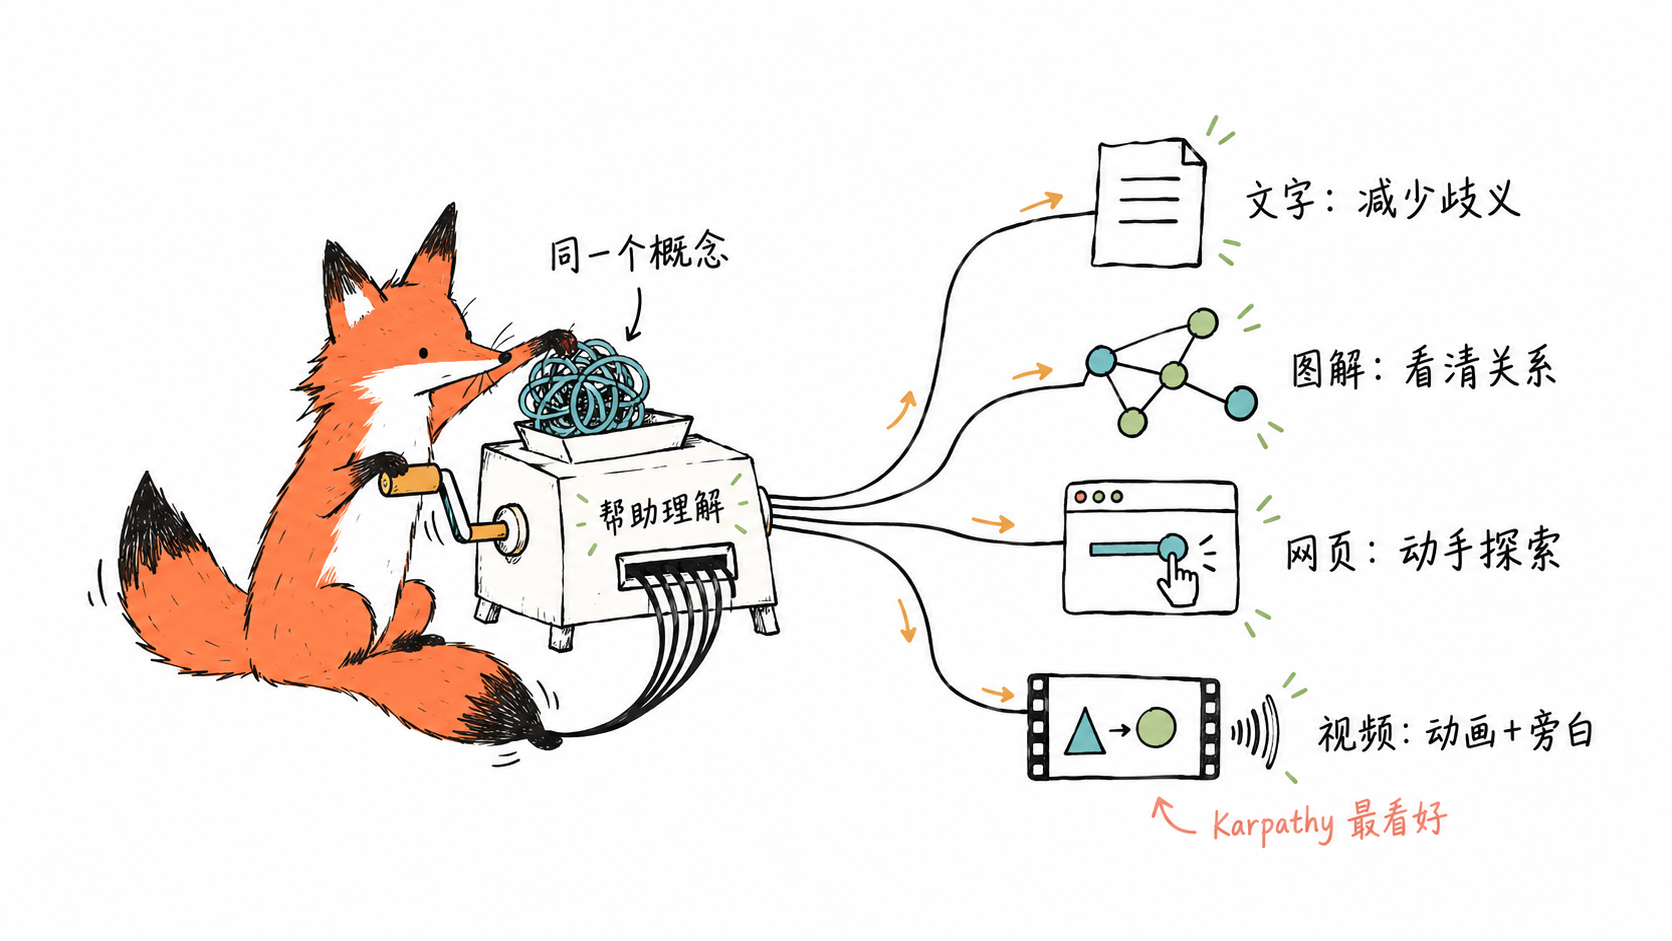
The image helps readers remember one relationship: the same concept can take different forms. It has little text, so the full explanation still belongs in the article.
I shared this skill in a post on August 15, 2026. I uploaded my avatar character and asked Codex to rebuild the illustration skill around it, then showed the results in the post.
When customizing a skill, you can retain its process for analyzing text, choosing a composition, and checking the image, while changing the character, colors, and style rules.
3.3 Baoyu infographics: put the core material into one image
Another useful option is baoyu-infographic, part of Baoyu's baoyu-skills collection. It organizes content into an infographic and offers layout and visual style choices. This experiment used a sectioned layout and a handmade paper-craft style to present Karpathy's main points.
The resulting infographic has three layers: how people's work changes at the top, the four explanation formats in the middle, and why disposable custom learning materials can make sense at the bottom.

It preserves the most information and works well for saving or sharing as a whole. On a phone, however, readers may need to zoom in to read the smaller text.
I have used Baoyu's illustration skills before. This post from August 14, 2026, about a marketing skills library is one example. The text introduces SEO audits, copywriting, and conversion optimization; the illustration makes the material easier to scan.
For an abstract idea, Xiaohei illustrations or fox-illustrations can turn it into a scene. For a more complete explanation in one image, consider baoyu-infographic. To plan illustrations throughout an article, baoyu-article-illustrator is another option. You could ask:
Turn this passage into a diagram. Preserve the key relationships and the original qualifications. Make the explanation understandable before adding decoration.
For structural diagrams that need precise checking, I also consider Mermaid or SVG. Whatever the format, check the labels and arrows.
4. Third format: let the reader interact with a web page
For this kind of task, I recommend the html skill in Effective HTML. It can turn an explanation, report, or complex concept into a standalone HTML page. If the material is mostly about flows, states, or system relationships, the collection's html-diagram skill is another option.
For this experiment, Codex used html together with design-artifact to turn the summary of Karpathy's idea into the page shown below.
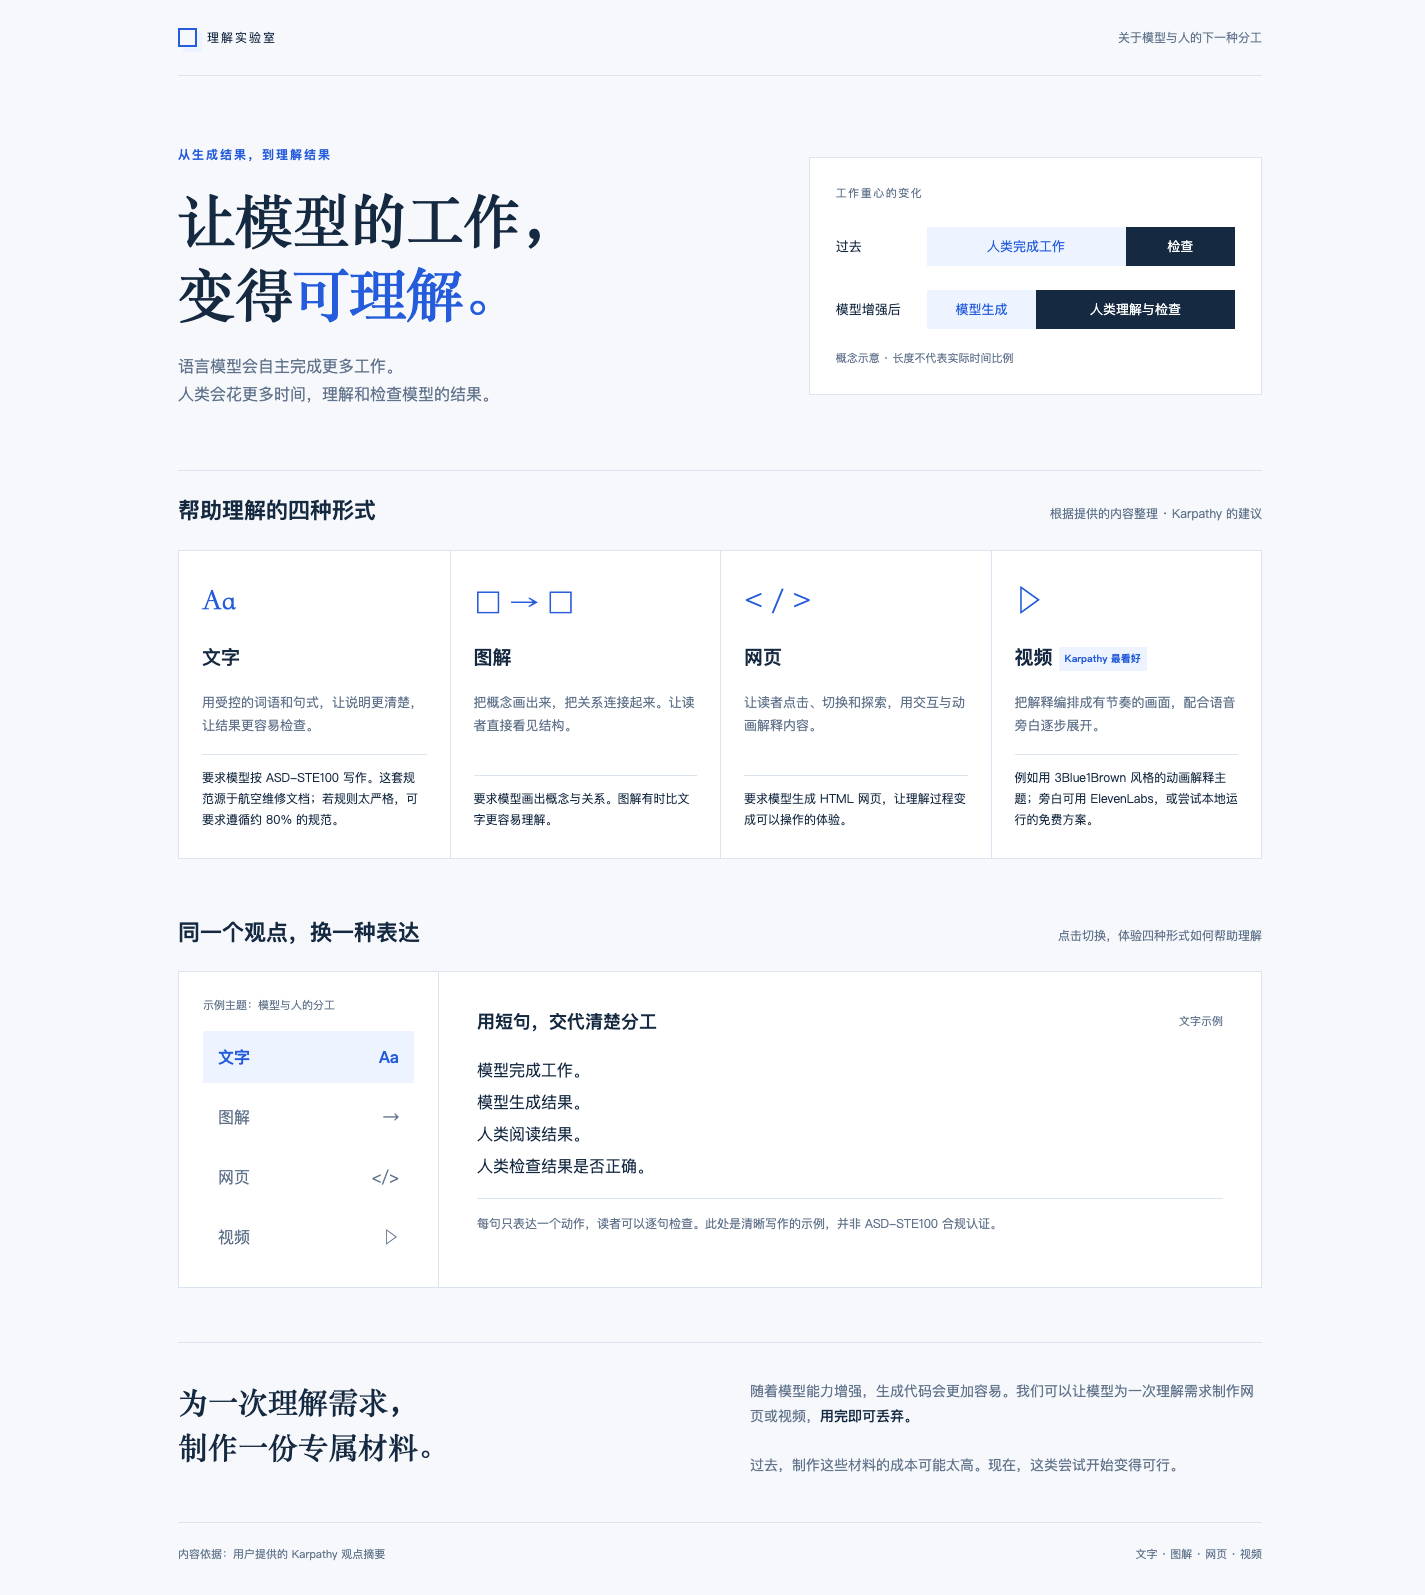
The page uses a cool white and blue “understanding laboratory” layout. The upper section explains how people's work changes and introduces the four formats. Below it, readers can switch between different versions of the same idea:
- Text: read the simplified explanation.
- Diagram: inspect the relationship between model execution, human understanding, and checking.
- Web page: switch between “before” and “with stronger models” to compare the focus of the work.
- Video: play, pause, or reset a three-step animation to experience the explanation unfolding over time.
The “video” panel is a silent web animation. The next section contains the actual video file. The work-focus illustration at the top is not measured data.
The page can be opened offline. Desktop and mobile layouts and keyboard interaction were checked when it was generated. It explains an idea rather than running a complex simulation.
I previously used these skills for MkAgent and shared the result in a post on August 24, 2026. The skill analyzed the code, organized the main nodes and relationships, and used the project's logo and theme to generate an interactive architecture page. Clicking a node reveals details on the right; playing the animation shows how calls unfold. The post includes a demonstration video, while the actual artifact is an HTML file.
I find this useful when reading an unfamiliar project: start with the architecture, open unfamiliar modules, then follow the call flow into the code. The nodes and relationships still need to be checked against the source.
If a model's written explanation leaves you unsure how a process changes, consider html: change a parameter and see the result, step through an algorithm's intermediate states, or switch conditions to explore different paths. Specify what the reader can control and what they should observe afterward:
Use the html skill to turn this process into a standalone HTML page. Let me inspect states step by step and change key parameters. Explain what happens at each step and why. Preserve the original conditions and qualifications; do not invent data.
5. Fourth format: make a narrated explainer video
A web page lets readers click and experiment. A video can explain the material in sequence, with narration. For this experiment, Codex used HyperFrames to make a Chinese explainer video of about 59 seconds about Karpathy's idea.
The video uses an off-white and dark green palette. It has six segments: the changing nature of people's work, the four formats, and finally the idea of making custom materials for one need to understand something. It includes text, relationship diagrams, entrance animations, and scene transitions. The narration uses a local macOS Chinese voice.
It is mostly an animated presentation of text and diagrams. It is still far from the mathematical derivations and continuous visual demonstrations associated with 3Blue1Brown. For this particular post, text plus a diagram already explains quite a lot. Video adds pacing and narration, but this example does not fully use animation's ability to explain a process.
In a post on August 11, 2026, I shared an earlier example: calling the HyperFrames plugin in Codex to produce a 45-second promotional video using information from the TanStarter template repository and the site's core feature descriptions.
I was happy with the motion, flow, and fit with the material in that example. I preferred it to a previous video I had repeatedly adjusted with Remotion. That was my experience with one project; it does not establish that HyperFrames is better for every kind of video.
That example is a product promotion. It demonstrates turning existing project material into video, rather than explaining a complex concept.
When a topic needs to show a process in sequence, a tool like HyperFrames may be useful. Start with the script and storyboard, then arrange the animation and narration. Examples could include algorithm execution, system state changes, or mathematical relationships that change with parameters.
First write a short storyboard for this process. Confirm what each shot should explain, then use HyperFrames to produce an explainer video with Chinese narration.
Producing a video involves scripting, visual timing, voice generation, rendering, and checking. Code generation and revisions consume tokens, rendering consumes compute, and external voice services may charge separately. Total cost was not recorded for this experiment, so it cannot establish how much more expensive video is than the other formats. I do not generate videos often.
6. Make AI output easier to understand
After trying four formats for the same idea, I think the first question should be what you do not understand, before choosing a tool. This experiment compares the artifacts' characteristics; it does not test comprehension speed or learning outcomes.
| What is unclear? | Tools to consider | What they help with, and what to check |
|---|---|---|
| An English explanation leaves conditions or actions unclear | asd-ste100 | Clearer wording that is easy to copy and quote; complex relationships and dynamic processes may still be hard to picture |
| Relationships between concepts or modules are hard to imagine | imagegen, ian-xiaohei-illustrations, baoyu-infographic | Put relationships in one shareable image; check text and arrows, and watch for dense text on phones |
| What happens when a parameter or condition changes | HTML and HTML Diagram skills | Switch conditions and explore step by step; interaction should serve understanding, and public sharing requires hosting |
| A process needs to be shown over time | HyperFrames | Organize the explanation with animation and narration; readers follow the playback pace, and production and revisions involve more steps |
If two sentences explain it, use text. If relationships are hard to picture, add a diagram. If readers need to experiment, make a page. If a process deserves a continuous demonstration, consider video. There is no need to produce all four every time.
When making several versions, start with a written source, then use the same material for images, HTML, and video. If something changes, each version can be checked against that source.
You can explore the skills mentioned here in OpenFree's Agent skills and tool libraries category.